This is an R shiny app that visualizes audit data using many tools all in one app.
audit-explorer is an R shiny app that visualizes Linux audit data using many
tools all in one app. With this program, you can interactively display:
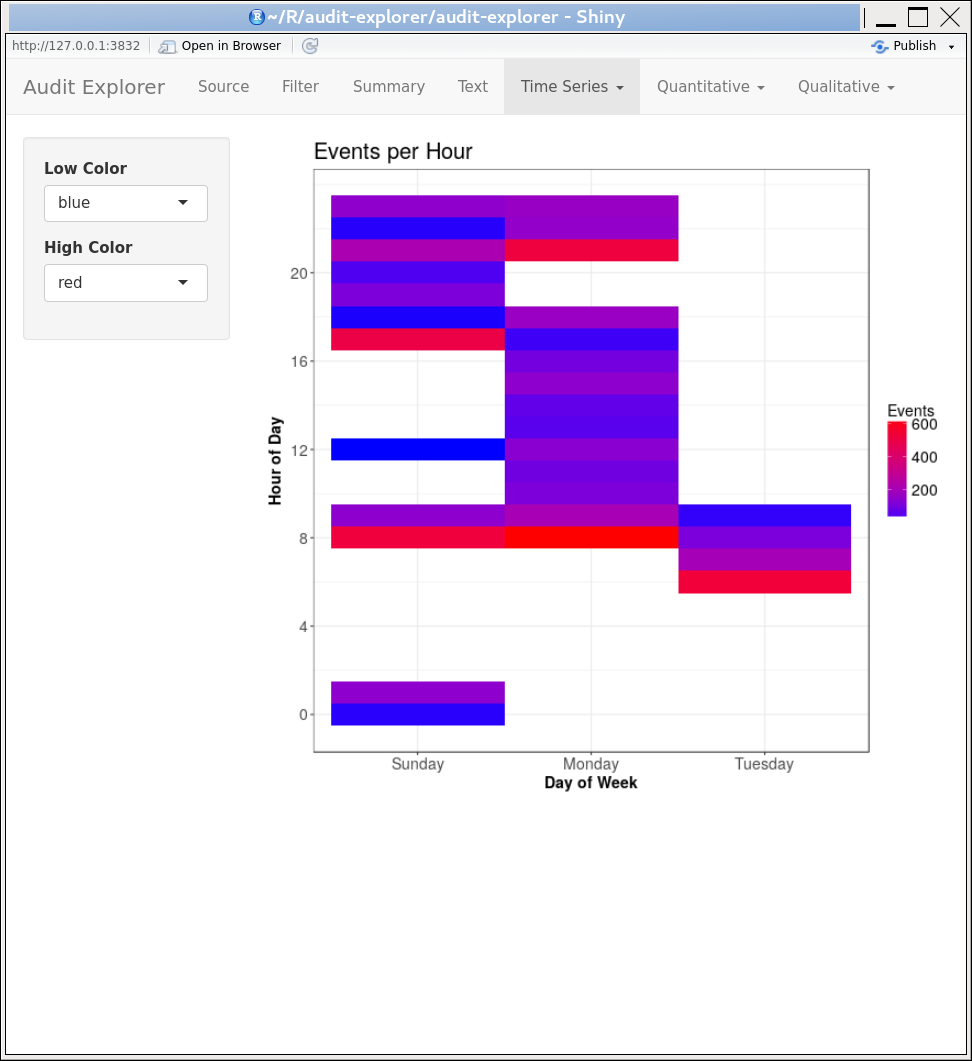
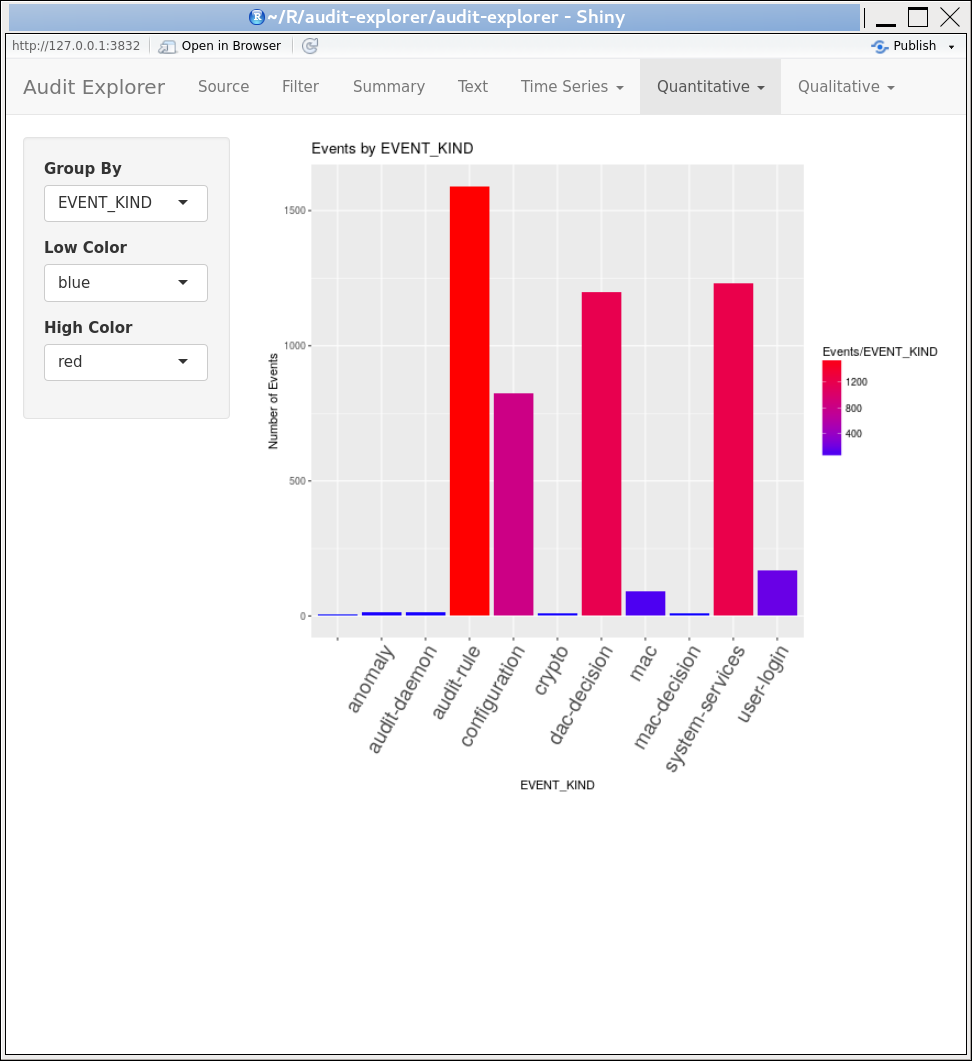
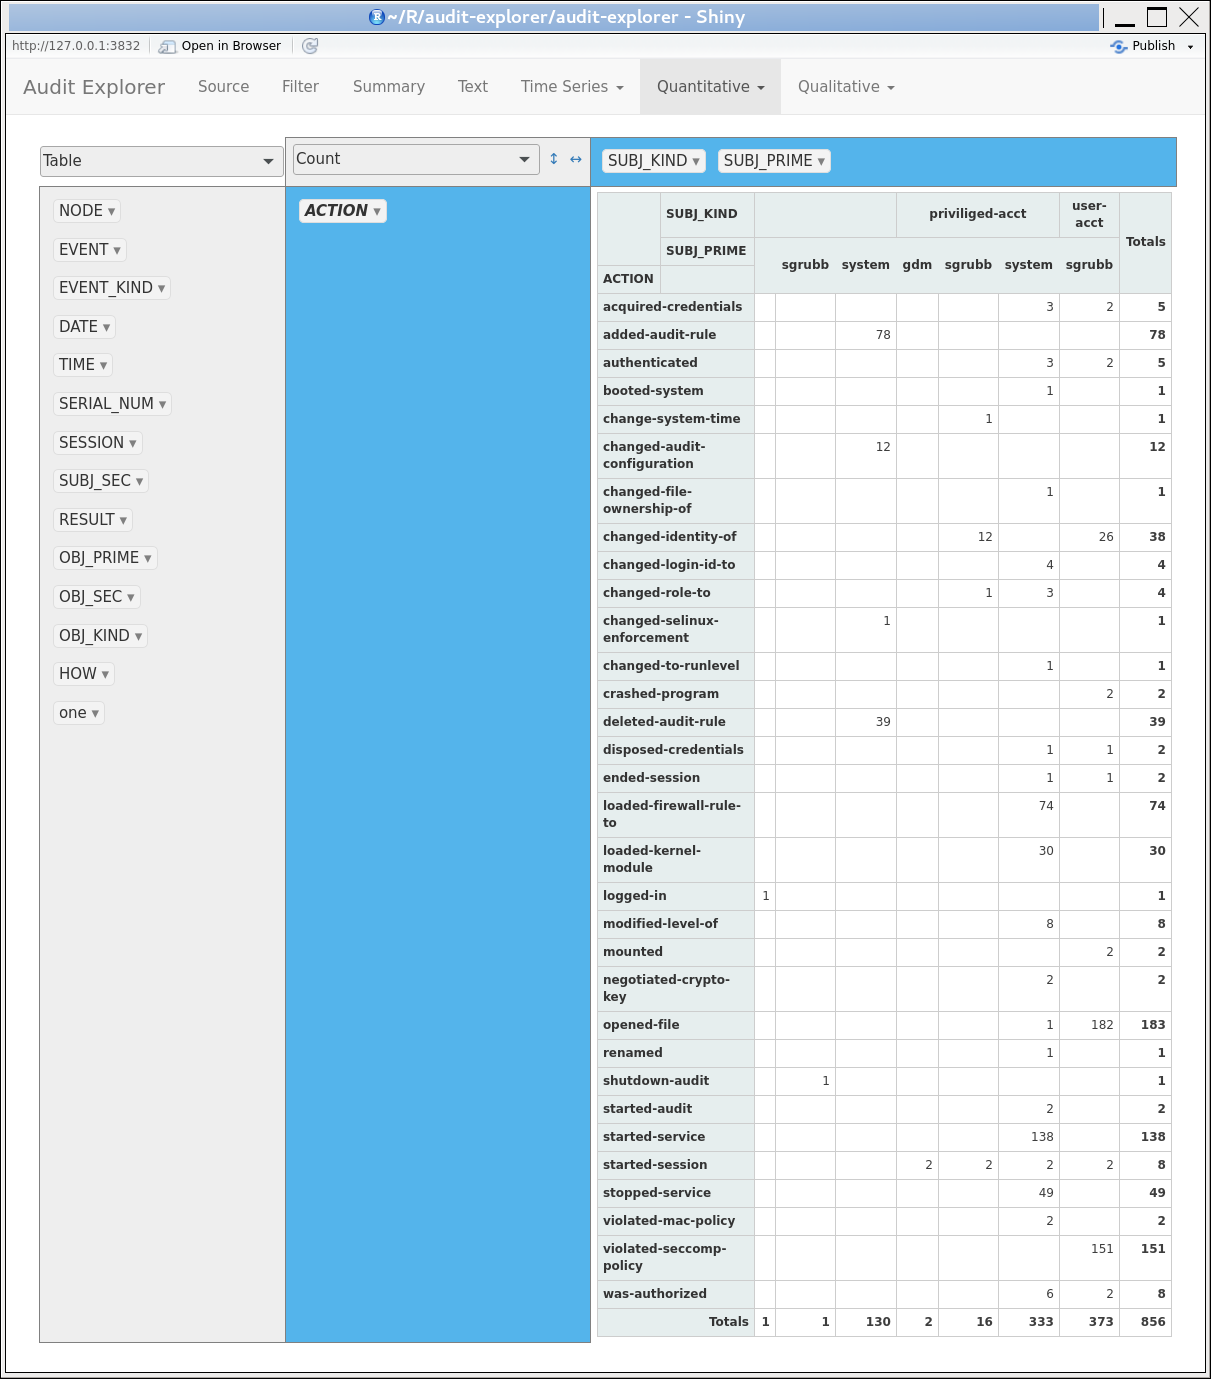
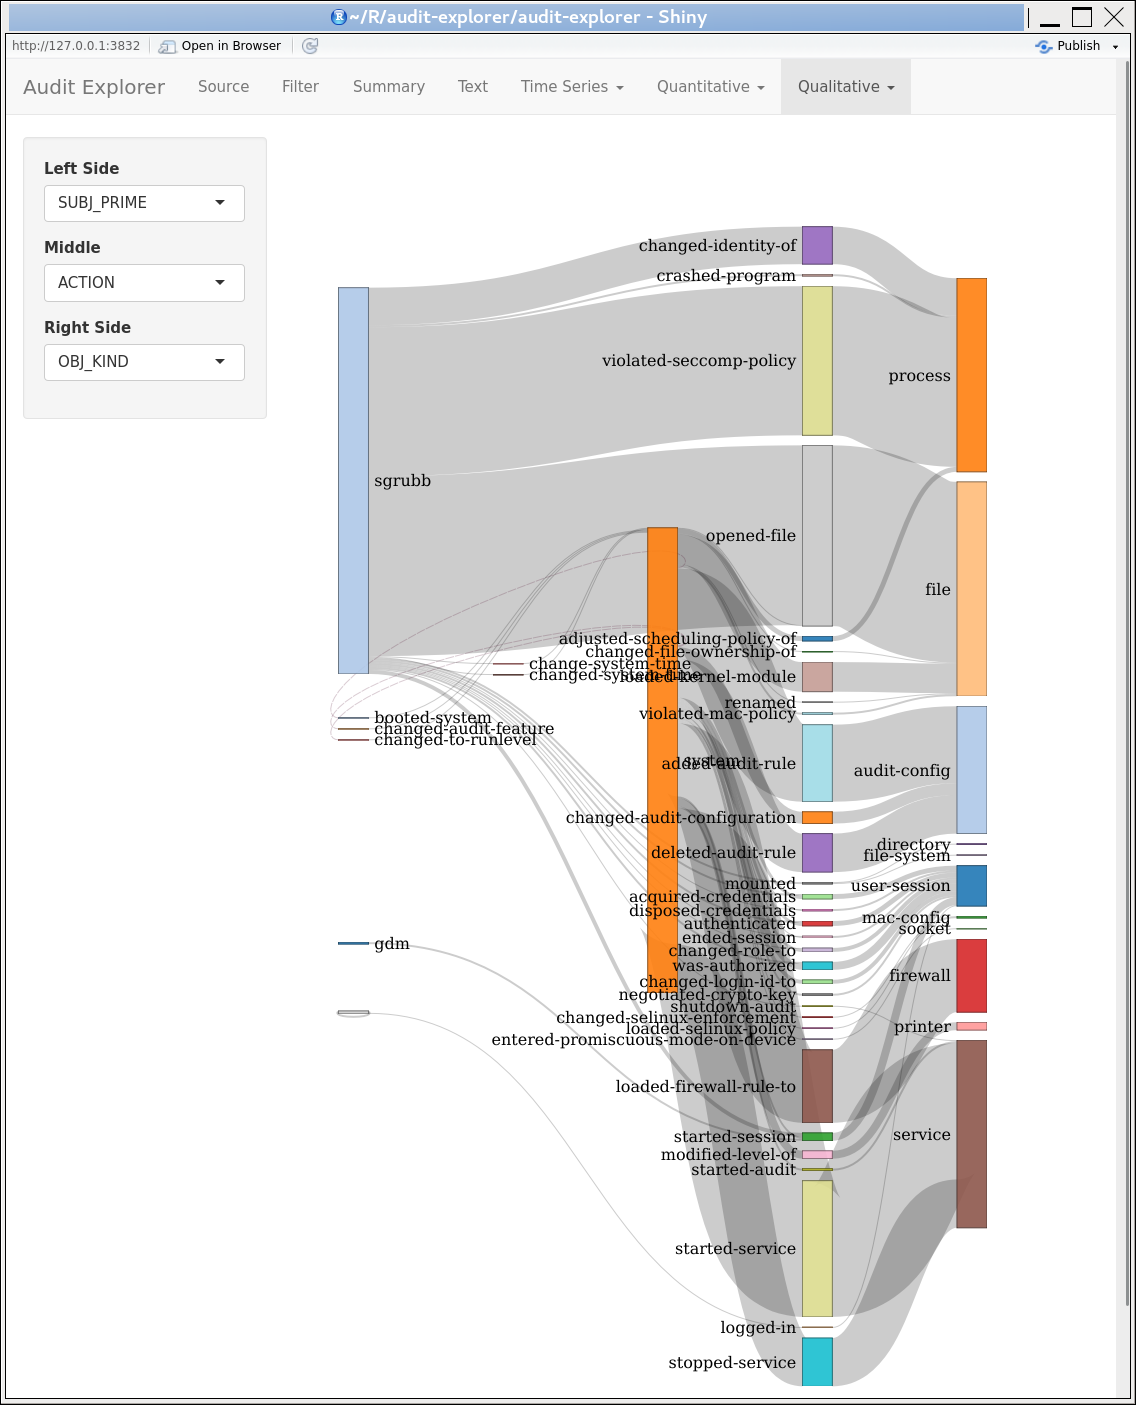
See below for some screenshots.
audit-explorer runs under RStudio. You should either download a copy of it
or build one as described here:
http://security-plus-data-science.blogspot.com/2017/02/building-r-studio.html
It also requires the following R libraries to be installed in RStudio:
It also uses the ausearch command to create the data files it needs to analyze.
To have working CSV generation, you should have the Linux audit-2.7.5 or later
package installed on your system.
The application is self-contained. It will expect the following directory structure to exist:
~/R/audit-data
To allow ausearch to work from RStudio, you should add a group, such as wheel,
to your account. This is in order to allow group read access to the audit logs.
Then go into /etc/audit/auditd.conf and set log_group = wheel. It does not have
to be wheel, but the group added to your account must match the one auditd.conf
has. Then restart auditd so that it can fix the directory permissions.
You can copy app.R to anywhere you want. You just cannot rename it. RStudio
expects shiny applications to be named app.R. I would recommend placing it
in ~/R/audit-explorer/.
1) Start up RStudio
2) Click on File|Open File…
3) Select app.R (wherever you put it ~/R/audit-explorer/ is recommended)
4) In the code pane, click on the Run App button
The program should start up. When its ready…
5) Click the Load Events button and wait for the text below it to change
6) If it says success, then click on the Filter tab at the top
7) Click on Use All Events
8) You can now click around on anything.
You can use the Filter tab to subset the events in many ways by using the
Operand1, Operator, Operand2 drop boxes and then click Filter Events. If you
want to go back to all events, then just click on Use All Events again. This
page always lets you know how many events out of the total are selected.
You can also place a CSV file at ~/R/audit-data/audit.csv
Then it can be opened using “Standard CSV” radio button from the Source menu
item. If you do this, the program assumes you have already preselected the time
range and options.
If you are using the Logs Event Source, then you can have extra data included in
the generated CSV file by checking the boxes under the Extra CSV Info to Include.
There has been discussion about the different diagrams and source code here:
http://security-plus-data-science.blogspot.com/
Questions may be asked on the Linux Audit Mail List:
https://www.redhat.com/mailman/listinfo/linux-audit
Audit explorer allows you to build different reports and diagrams based on
the contents of the audit trail. Your feedback about what kinds of diagrams,
reports, or dashboards that you would like to see pre-canned as a part of
an audit reporting tool would be greatly appreciated. It may be a part of this
tool or some other web based tool being considered for the future. For
example if you are interested in a heat map to detect anomalies, should there
be any pre-filtering by default? Any ideas, suggestions, and proposals with
or without screenshots are welcome. Please send them to the linux-audit mail
list (see above) or you may file an issue - whichever is easiest. Your
contributions and feedback are greatly appreciated.
audit-explorer is released under the GNU Affero General Public License v3.0.