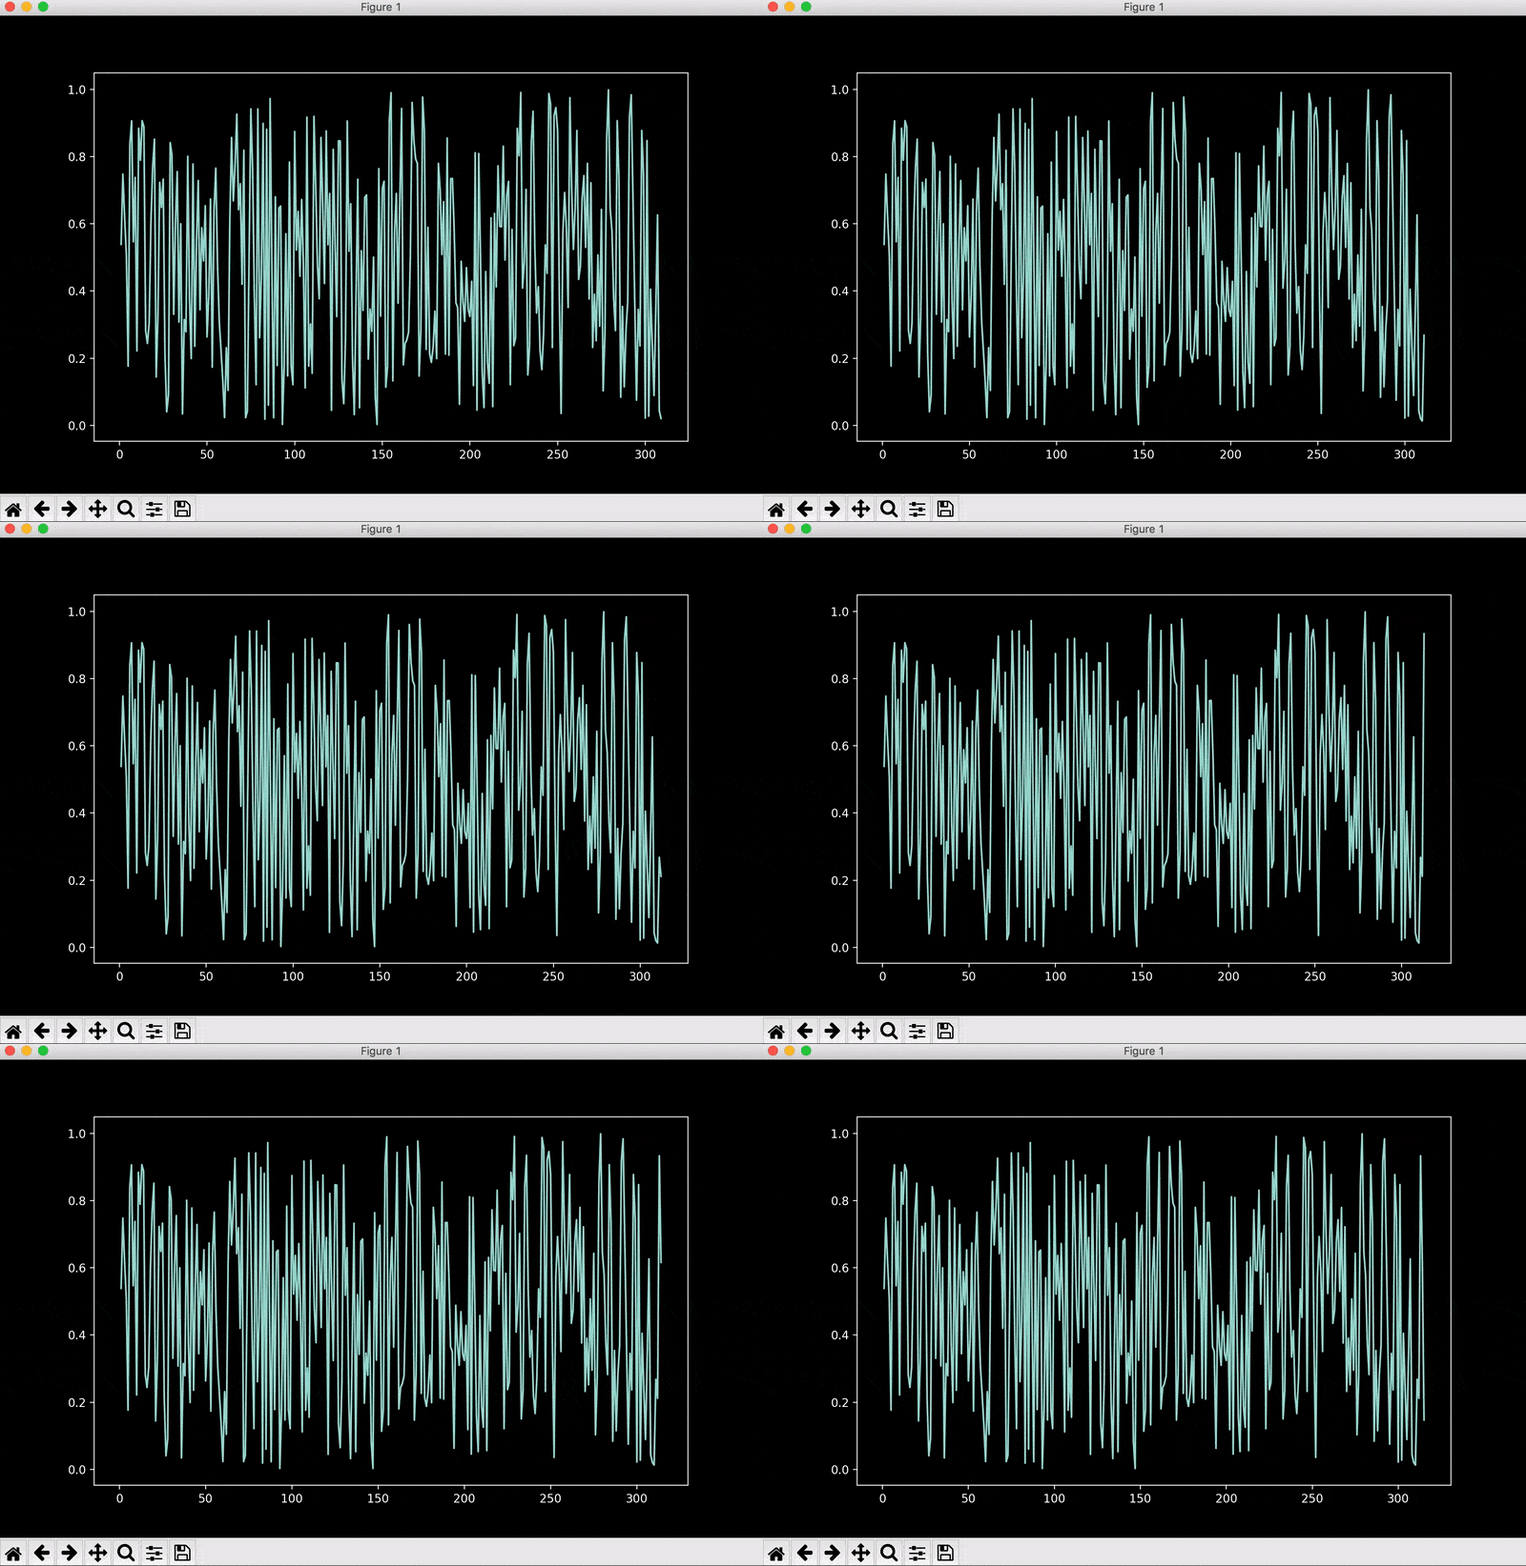
Live graph plotting with matplotlib in Python3 language
Live graph plotting with matplotlib in Python3 language.
$ [sudo] pip install matplotlib
$ [sudo] apt-get install python3-matplotlib
$ git clone https://github.com/somdipdey/Live_Graph_Plot_With_Matplotlib_In_Python3.git$ [sudo] mv Live_Graph_Plot_With_Matplotlib_In_Python3 liveplot$ [sudo] cd liveplot
Can read contents in comma separated format (X,Y) from .TXT or .CSV file as follows:
$ [sudo] python live_plot.py my_csv_file_name.csv
Provide my_csv_file_name.csv or my_csv_file_name.txt (name of the file containing X,Y readings) from the same directory/folder or else provide the full path with ‘sudo’ command
