3D Genome Browser
![]()


![]()
![]()
TADkit is a HTML5 and JavaScript-based 3D genome browser. It makes use of D3.js for rendering the 1D and 2D tracks and WebGl by Three.js for rendering the 3D track.
TADkit is currently developed at the MarciusLab with the contributions of Mike Goodstadt, David Castillo and many maembers of our Lab.
TADkit creates interactive 3D representations of chromatin conformations modeled from 3C-based interaction matrices.
The user can overlay 1D and 2D tracks of genomic data to these 3D views to directly evaluate the relationship
between the 3D structure of the genome and its biological function.
To install TADkit in your server or locally, you need to download the repository and move the “tadkit” folder
in your desired directoy. Next, point your browser to the index.html file in that directory. If you want to install it
locally you’ll need to use Chrome with the flag “—allow-file-access-from-files” to run JavaScript locally (additional information for other Internet browsers here.
Visualization of 3D models and overlaying of data for analysis in TADkit is achieved in three simple steps. (1) The user may import a TADbit JSON file by using the drop-in area or the file menu in the TADkit main page. (2) The user is presented with an overview of the data. Each 3D model cluster is shown as an ensemble of grey strands, with its centroid model highlighted. After selecting a cluster, the browser view opens (see figure below) with a 3D scene of the centroid of the selected cluster, along with “classic” genomic tracks. (3) Finally, the user may add additional genomic tracks to the browser by inputting them using BigWig or BedGraph formats.
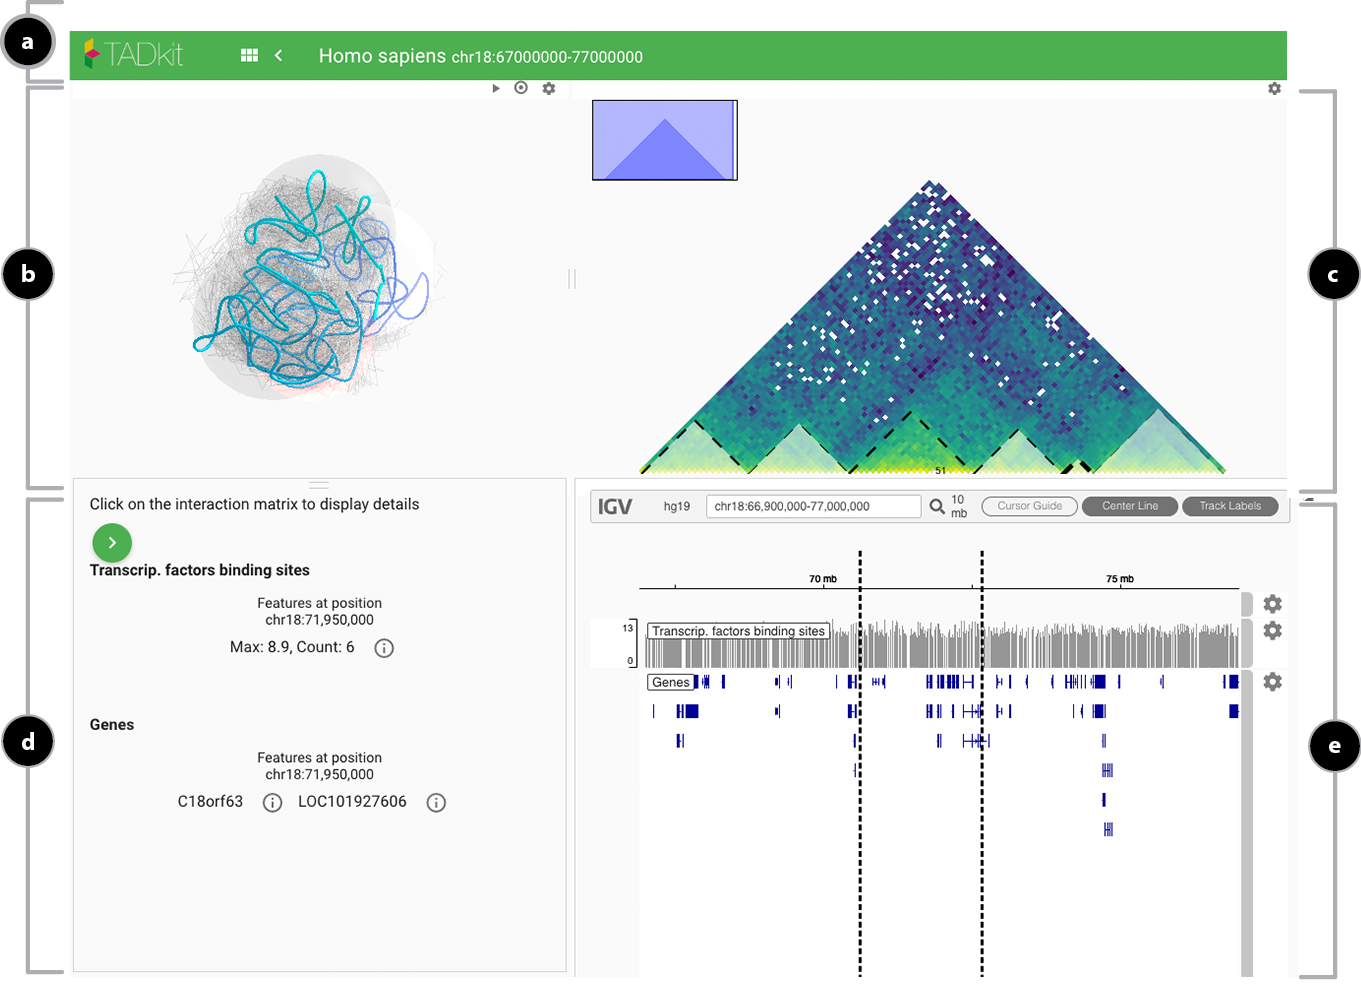
The browser view is composed by: